


Build Powerful Flow Charts with AI
Save 10+ hours and Boost Workflow using Diagrams and Charts

Hey AI Explorer,
Welcome back to the latest edition of your Friday newsletter “Solve with AI”.
I started my career in an analytics and data role so data is core to everything I do. My podcast is also called Analytics Today and is one of the leading business podcasts.
But guess what?
Data does not tell you the full story on its own.
You need to extract insights from data and make it actionable. There is no shortage of data. You and I live in the age of a massive influx of data from everything i.e. social, sensors, phones, cars, and gadgets.
At the professional level, dealing with company data to produce insights is the next level of the data challenge.
I've been particularly interested in how AI can help to convert raw data into useful charts and diagrams.
I also use flow charts to brainstorm ideas and building a flow chart from scratch is painful.
Whether you're a seasoned data professional or a curious entrepreneur, I want you to start experimenting with generative AI to transform raw data into powerful charts.
The question is where do you start?
I suggest start with a smaller use case and then expand as you develop the skills using the techniques below.
Here are a few examples:
Develop a flow chart for a small part of your business process.
Extract insights to highlight in your next board meeting.
Prepare a flow chart to learn a new language.
Map the journey of your sales team and identify bottlenecks
Develop a campaign flow for your marketing campaigns
AI gives you endless possibilities.
Let’s pick a use case and I will show you how you can create an amazing flow chart like this one.
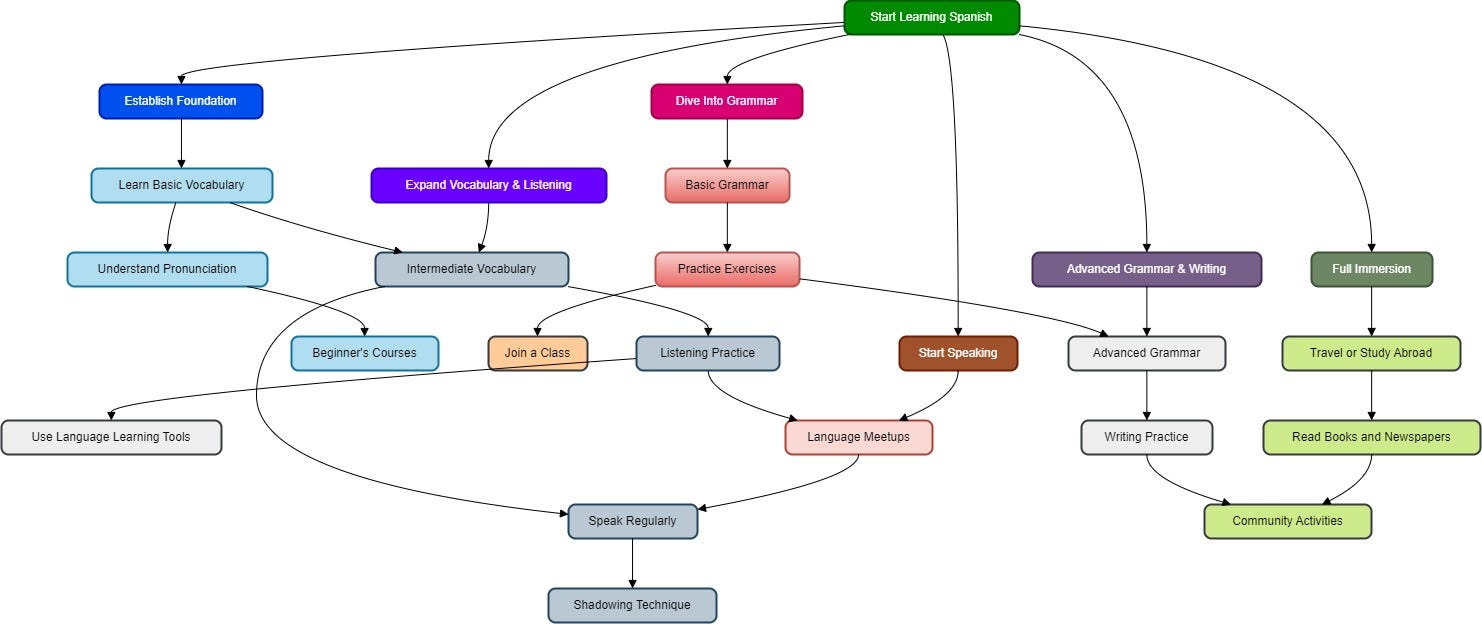
This flow chart shows how someone can learn the Spanish language from scratch. Besides highlighting the basic steps, the flow cart goes into the dependencies with other steps.
The best part is the entire chart was created using AI and a charting tool.
Keep reading with a 7-day free trial
Subscribe to Solve with AI to keep reading this post and get 7 days of free access to the full post archives.