


TradingView AI Cockpit Every CXO Needs Before the Next Market Shock
How CXOs Are Outsmarting the Market With AI & TradingView

Hey AI Productivity Explorer,
In 1933, legendary pilot Amelia Earhart prepared for her record-setting solo flight across the Atlantic. The cockpit was small, the gauges basic, and the sky stretched endlessly, a mix of blue promise and hidden danger.
Earhart’s secret wasn’t just her skill. It was her obsession with pre-flight signals, weather patterns, and barometric drops, as well as distant storm warnings sent by ships hundreds of miles away. She built her own “macro dashboard” before takeoff, sketching risks and probabilities in a notebook. “Preparation,” she said, “is two-thirds of any adventure.”
Midway through the flight, a bank of storm clouds appeared ahead.
Her small instruments couldn’t show the full picture, but her earlier alerts let her anticipate, adapt, and change course, beating the storm and making history.
Earhart knew that the best pilots don’t just track what’s right in front of them. They gather signals from every source, i.e., market, weather, and innovation, to see beyond the horizon before anyone else.
Today’s leaders still run companies with beautiful dashboards packed with sales, pipeline, churn, and supply metrics, yet miss the warnings that come from outside: the AI hype, global volatility, credit shocks, or social sentiment storms.
You see it everywhere:
Reddit and r/WallStreetBets took GameStop from a sleepy retailer to a $20 billion meme stock in a matter of days. Thousands of corporate dashboards still showed stable revenues, while the real action, the surge of retail trading, short squeezes, and media frenzy, unfolded on social platforms in real time. The warning wasn’t in a quarterly earnings report. It was in the chat room.
Elon Musk’s tweets have wiped billions off Tesla’s valuation or added it back sometimes within an hour. Most risk dashboards simply can’t price in the effect of a viral post, but markets react instantly.
When Silicon Valley Bank was hit by a sudden social media-fueled run, VCs and founders were texting and tweeting “move your money” before any dashboard picked up on the crisis. The internal finance metrics looked fine—until the world changed in a day.
Even inflation, once a slow-moving beast, now moves at the speed of sentiment: a TikTok video about gas prices or grocery bills can spark nationwide stories and consumer pullbacks long before CPI numbers show up in your BI tool.
It’s not just about market data versus company data, but recognizing that the real leading indicators, the signals that move capital, change hiring plans, or trigger pivots, are now embedded in the way AI, sentiment, and viral networks interact.
Amelia Earhart didn’t wait for turbulence to hit. She built a cockpit that let her sense what was coming and made bold moves before the rest of the world caught on.
That’s the spirit behind this post.
My goal here is to show you how to strip away noise and build a cockpit that puts macro, market, risk, and innovation signals right beside your internal ops live, in context, with real alerts.
So instead of just reacting to a viral market-impacting X post, you are charting a safer, smarter course even in uncharted skies.
Table of Contents
Why Your Dashboard Is Lying to You
Inside the Cockpit: The 4 Panels Every Leader Needs
How Each Alert Works (and What to Do When They Trigger)
The Daily Workflow: Five Minutes to Clarity
Steal My Setup: TradingView Template & Scripts for Paid Subscribers
One Dashboard, a Dozen Moves Ahead
Disclaimer: I (Sameer Khan) or Solve with AI or Inspiring Insight LLC are not financial advisors, investment professionals, or legal counsel. This newsletter post and dashboard guide/templates are for informational and educational purposes only and do not constitute financial, investment, legal, or business advice. While tools like TradingView and AI-powered indicators can provide valuable insights, all markets involve risk, and the applicability of any strategy or signal will depend on your unique situation. The information, scripts, and dashboards provided here are not guarantees of performance, nor should they be relied upon to make trading or business decisions. Always consult a qualified financial advisor or other professional before acting on any information in this post. Neither the author, publisher, nor any affiliated entities, employees, contractors, partners, heirs, or assigns shall be liable for any direct, indirect, incidental, or consequential damages arising from the use of, or reliance on, the information, scripts, or dashboards shared here. Use at your own risk.
Why Your Dashboard Is Lying to You
Most corporate dashboards are beautiful, sleek, colorful, and full of real-time updates. Sales targets tick upward. Ops metrics glow green. Customer NPS holds steady, and somewhere, someone’s proud of a new pie chart.
None of those charts warned you about the last big market shakeup on Friday.
Did it?
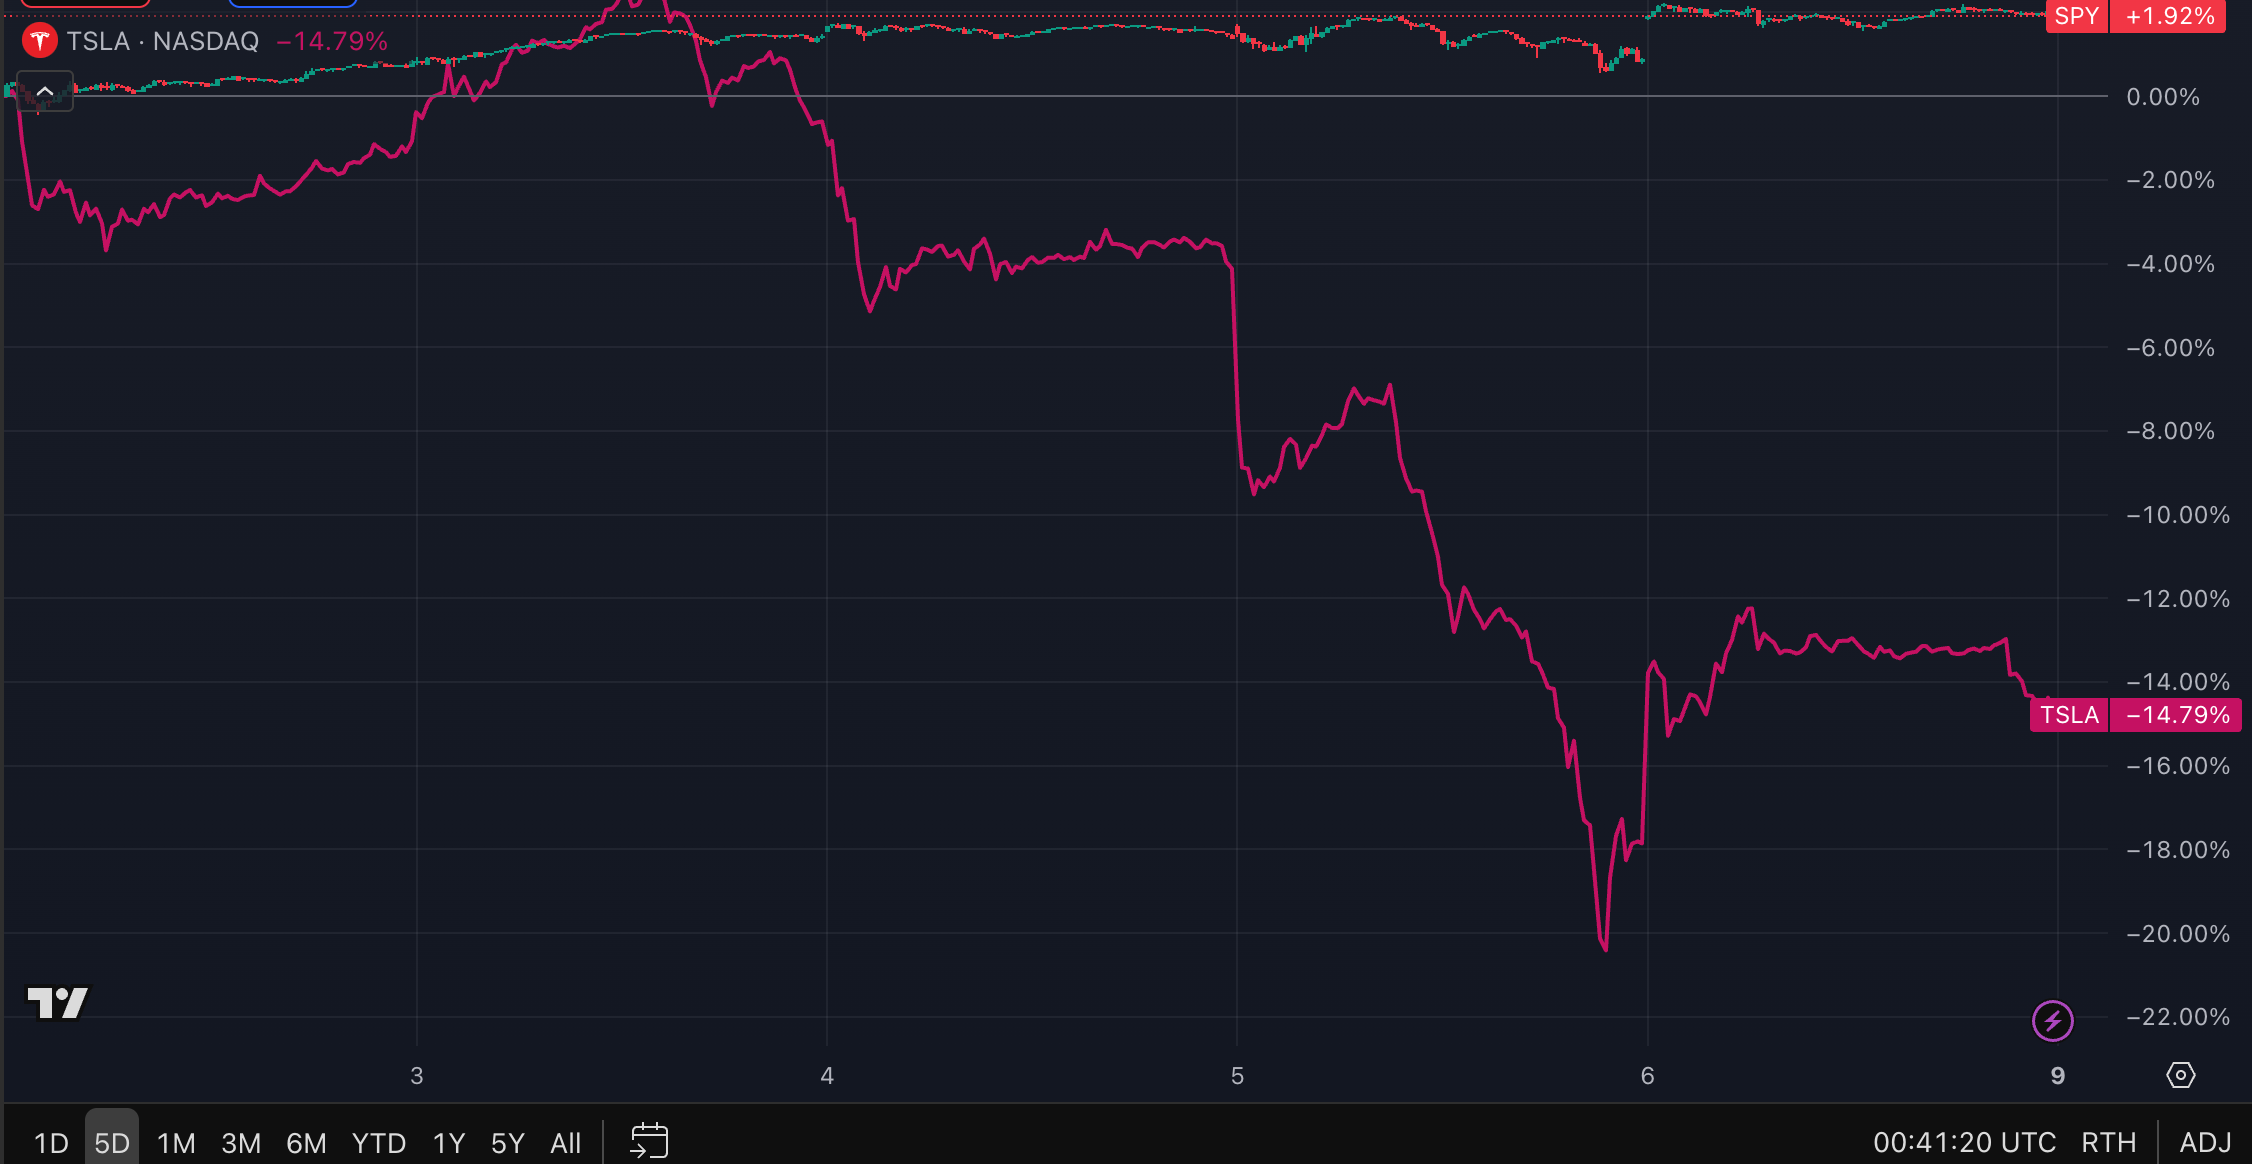
Source: TradingView Tesla 5-day performance
Not when rates spiked, or when X debate stripped $150bn from Tesla and billions in overall impact.
We’re in an era where algorithms move faster than analysts.
Today, a breakthrough AI launch, a viral social headline, or a new open-source model can send billions of dollars flowing from one sector to another overnight, leaving “internal-only” dashboards scrambling to catch up.
Most leaders still run companies with beautiful dashboards packed with sales, pipeline, churn, and supply metrics, yet miss the warnings that come from outside: the AI hype, global volatility, credit shocks, or social sentiment storms.
The truth is, your most “real-time” BI tool can’t see what the market is about to do—because it’s designed to measure only what’s already happened inside your own four walls.
So, why TradingView?
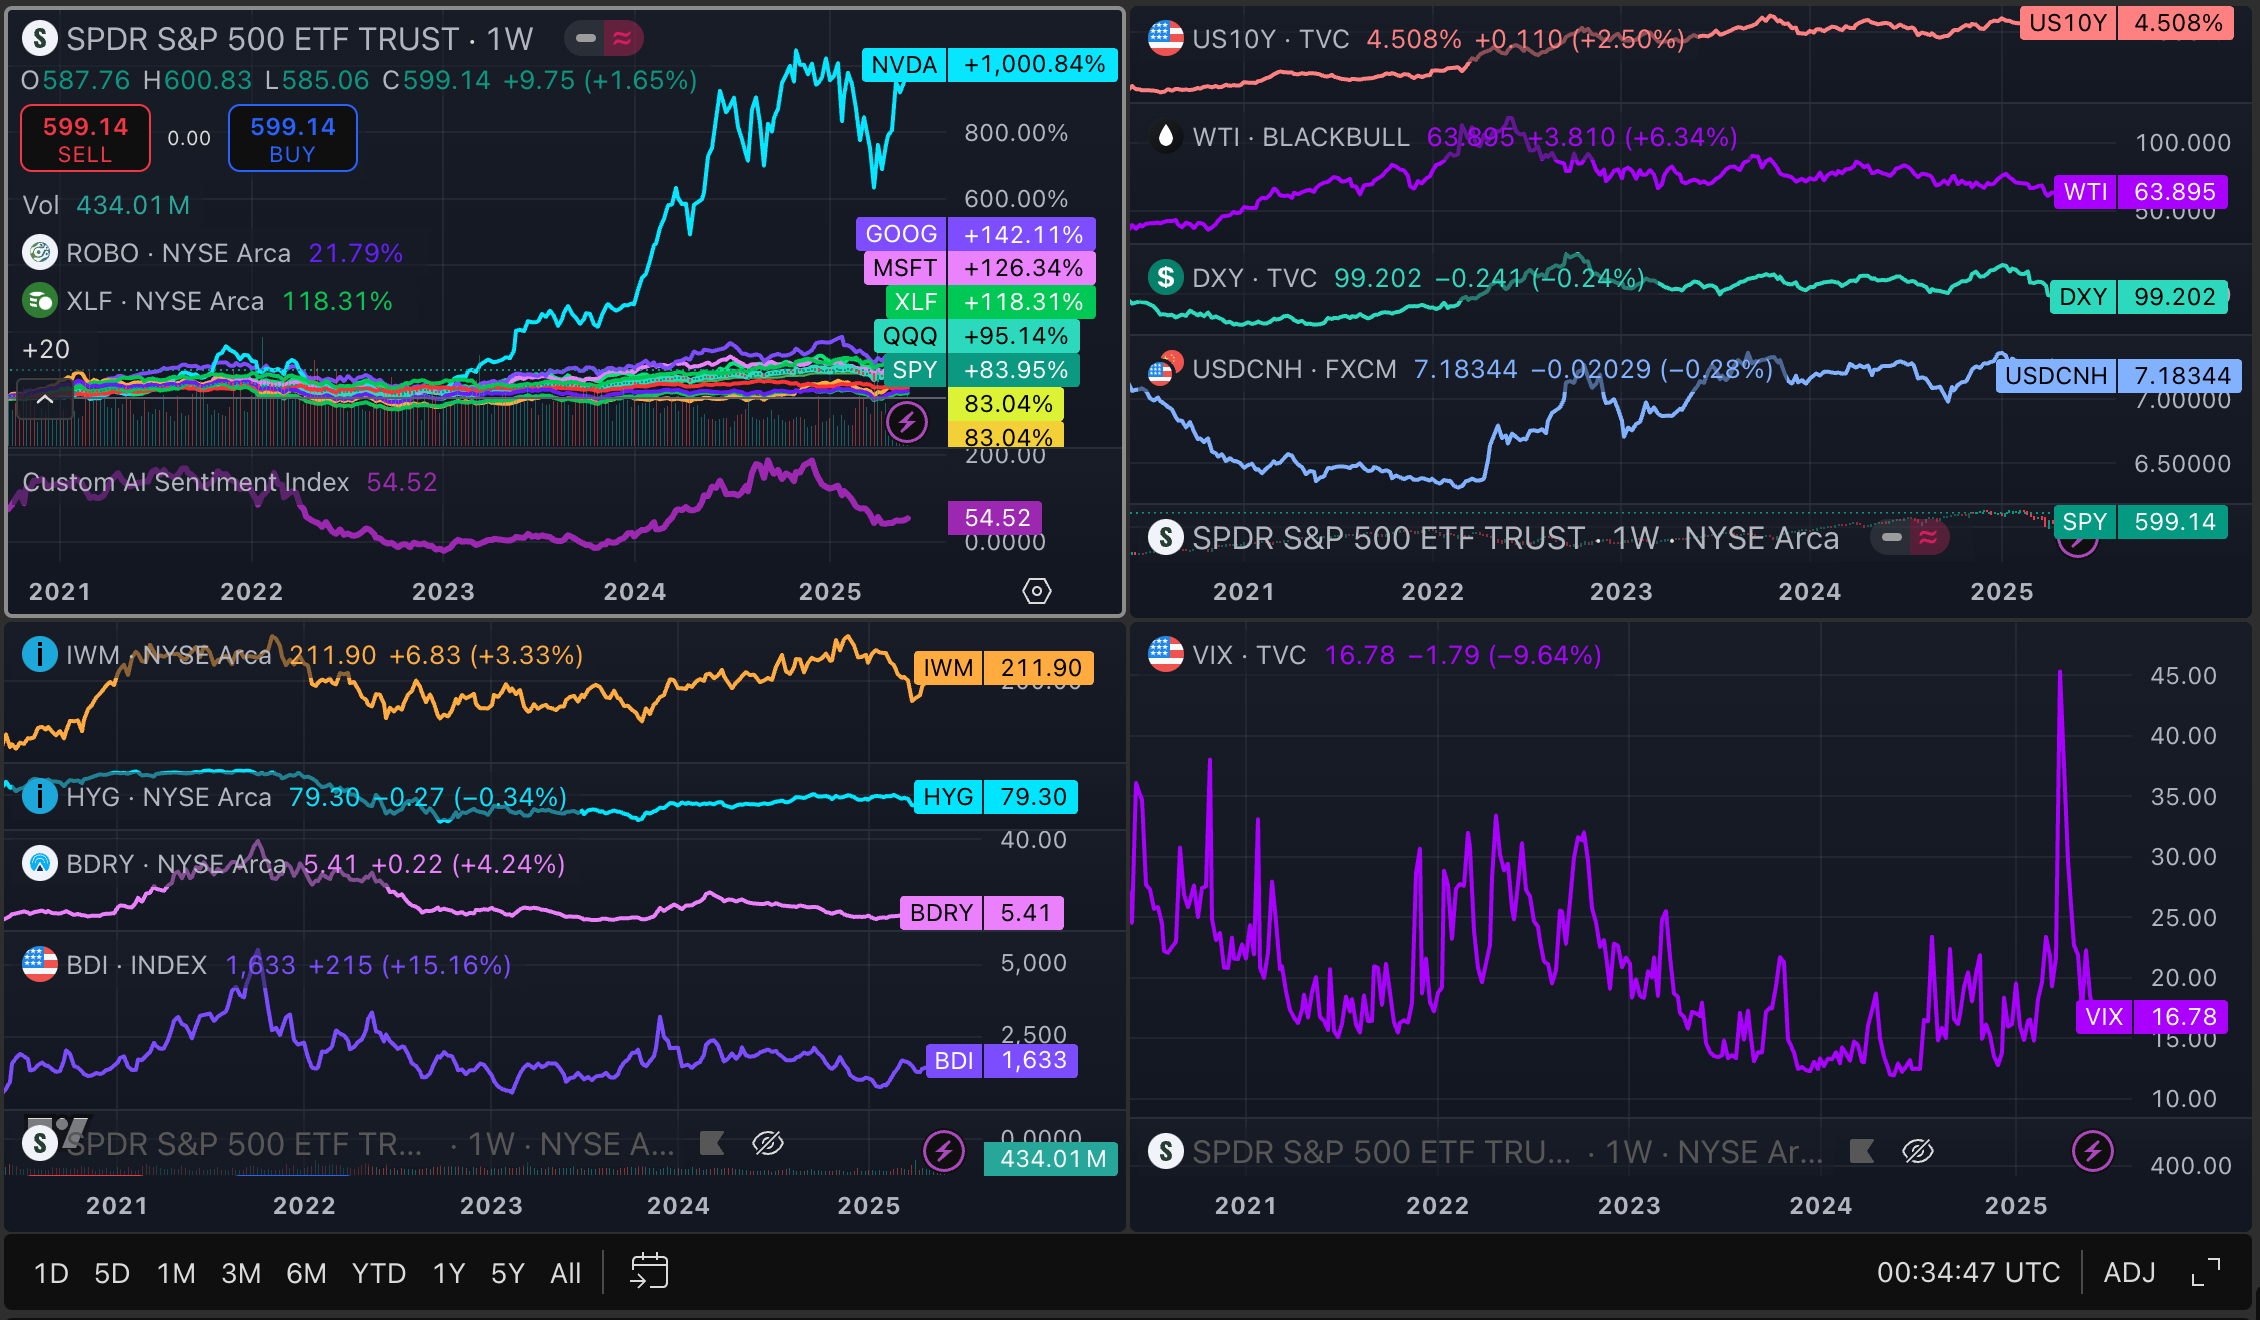
Source: TradingView
Because while most dashboard and BI tools lock you inside your own data silo, TradingView lets you watch the market itself live, raw, unfiltered.
TradingView is a popular platform in the trading community with millions of users. However, no one is using TradingView the way I am suggesting, and it will change the way corporations and CXOs track performance.
TradingView can become your “signal board” that can track the heartbeat of AI stocks, credit stress, macro shocks, and even sentiment-driven regime changes, all without a single upload from your ops team.
Instead of waiting for a slow analytics refresh, you can plug straight into the same signals that world-class investors, hedge funds, and macro strategists use.
You see the next wave coming, not just the last one passing by.
Inside the Cockpit: The 4 Panels Every Leader Needs
If you want to lead in a world that changes overnight, you need more than KPIs and pretty charts.
You need a cockpit, i.e., a single screen that puts you in the pilot’s seat with real-time signals from every critical domain: innovation, macro, credit, and risk.
Instead of your Tableau or PowerBI, this becomes your market radar, your edge board, your advanced warning system.
At the surface, the TradingView dashboard/cockpit includes 4 sublayouts. Each is solving a specific problem and quickly giving you an instant pulse on the market.
Here’s what it looks like, and why it matters:
Panel 1: AI & Tech Sentiment Index

This includes a custom, living mood ring for the AI and innovation trade made up of names like NVDA, MSFT, GOOGL, AAPL, QQQ, BOTZ, and ARKQ, all moving together to create a single pulse.
On top of that, I used pinescript (TradingView’s scripting language) to plot a Customer AI Sentiment Index. (I will share with you my TradingView templates and scripts below)
The Custom AI Sentiment Index is a real-time pulse check on the trends driving the AI and tech sector.
This index blends the price action of the world’s leading AI and innovation players, think NVIDIA, Microsoft, Google, Apple, and specialized ETFs like BOTZ and ARKQ, into one composite line.
It’s a crowd-sourced measure of how much conviction, capital, and momentum are pouring into the AI revolution at any moment. When the index trends higher, it signals surging optimism and market appetite for AI, innovation, and digital transformation. When it falters, it’s often the first warning that hype is cooling, risk appetite is fading, or a sector rotation is starting, giving you an edge before internal adoption metrics or headlines catch up.
It tells you if the market is rewarding innovation or about to punish risk-takers.
What to watch:
Trend crosses (20/50 SMA):
When the fast line drops below the slow, history says capital flees, innovation budgets get cut, hiring freezes start, and just in time turns into not right now.
Breakouts:
When the index surges above its bands or recent highs, that’s FOMO. Expect a rush for talent, higher vendor prices, and suddenly, everyone’s an AI-first company.
Sentiment shocks:
Watch for those days when a viral announcement triggers a multi-stock surge, even before earnings or customer wins show up in your own numbers.
Use case: The day after OpenAI released GPT-4o, you saw AI tickers break out. Those who spotted it on their cockpit shifted hiring and spending within hours, not months, locking in a first-mover advantage.
Panel 2: Macro Forces—Rates, Commodities, Currencies

This panel is your flight radar for what every CFO, board, and investor is quietly obsessing over, i.e., US 10-year yields (cost of capital), WTI crude (energy/inflation), DXY (dollar strength), USDCNH (China risk).
You can’t set pricing, plan expansion, or close a deal in 2025 without knowing where money is flowing.
Yields up? Funding dries up. Oil up? Costs soar. Dollar up? Emerging market pain and your supply chain feel it next quarter.
What to watch:
Yield trend shifts:
A MACD or SMA cross in US10Y isn’t just for traders; it means the capital tide is turning. Expansion might get expensive, or cheap.
Oil spikes:
A breakout in WTI can double your logistics bill. Watch for sudden moves to decide when to hedge or lock in contracts.
Currency breaks:
Dollar or yuan surges tell you when it’s time to revisit overseas bets, vendor pricing, or customer risk.
Use case: In Q2, a sudden rise in US10Y showed up in your cockpit before your treasury team could send an internal memo. You paused a major financing round, saving millions in future interest.
Panel 3: Credit, Small Caps, Supply Chain

This panel includes a composite signal for real-world business health, i.e., credit (HYG), small cap equities (IWM), and global trade (BDRY/BDI).
This is where you catch trouble before it shows up in the P&L.
HYG cracks? Weak businesses are about to default, customers delay payments, and B2B spending drops.
IWM falls? Small businesses, the backbone of the economy, are pulling back.
BDI/BDRY spike? Shipping costs and supply delays are coming for you.
What to watch:
Credit stress:
When HYG’s 10/50 SMA crosses, you’re weeks ahead of credit market headlines. Time to review liquidity and collection risk.
Small-cap slumps:
IWM drop = rising risk of churn or partner failures.
Supply chain surges:
BDI/BDRY up fast? Start calling suppliers—costs and delays are inbound.
Use Case: Before a supply chain crunch made headlines, your cockpit’s BDI alert fired. You got priority on inventory, while competitors scrambled.
Panel 4: Volatility/Regime Risk
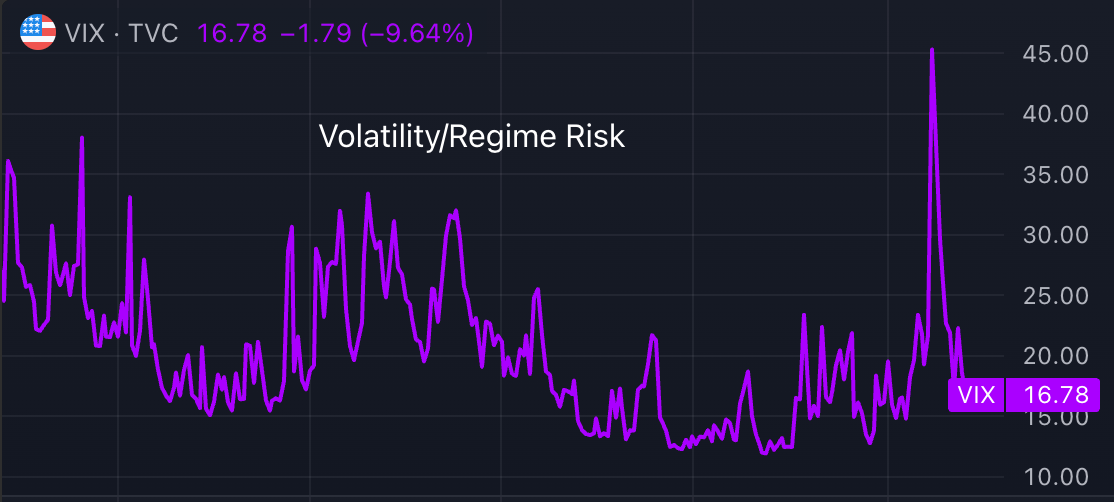
This is your weather radar, the VIX, plus trend signals (Bollinger Bands, MA crosses) to spot risk-on/risk-off flips. The VIX is fear, plain and simple.
When it’s calm, raise money, launch products, and lean into risk.
When it spikes? Pause, communicate, and cut exposure because the board, your investors, and your best customers are all doing the same.
What to watch:
Break above 20:
Volatility’s back. Funding is harder, decision cycles are slow, and everyone wants reassurance, not risk.
Trend breakouts:
VIX surges above its upper band? That’s a regime shift. Next stop: layoffs, pivots, and margin calls in the news.
Use Case: VIX crossed 20 on your dashboard. You delayed a major product announcement and focused your team on retention, not acquisition, dodging a wave of churn others never saw coming.
Each panel is a lever. One alert lets you shift strategy, protect downside, or seize the next wave before internal metrics can even catch their breath.
The Daily Workflow: Five Minutes to Clarity
Let’s be honest, no one wants another dashboard to babysit.
The idea is not more data but a simple five-minute ritual that lets you step into every day knowing where the world is headed, before it lands in your inbox.
Here’s how to work the cockpit like a pro:
1. Scan for Overnight Alerts
Open your TradingView cockpit first thing. If any alert has triggered a trend break in AI, a surge in volatility, or a credit shock, move it to the top of your agenda.
Don’t wait for a weekly meeting or a BI refresh. Move first.
2. Quick-Glance at Each Panel
Give each pane a 10-second check:
Is the AI Sentiment Index breaking out or rolling over?
Any spike in yields, oil, or currencies?
Is credit stress rising, or supply chain signals flashing yellow?
Is the VIX creeping up toward panic territory?
If anything looks off script, flag it and dig one layer deeper; often that’s enough to spot a regime change early.
3. Decide: Defend, Attack, or Pause
If your cockpit is calm, move forward with confidence.
If a panel is on alert, brief your team, tweak your roadmap, or hit pause on risky moves.
4. Communicate Proactively
Send a quick note to your team or board:
“VIX just spiked, let’s prep a contingency call.”
“AI sector momentum rising, let’s revisit that pilot we put on hold.”
You become the source of clarity, not the one reacting late.
5. Log the Moves (Optional)
Take a weekly screenshot of your cockpit with any major alerts, and file it, or now ask your BI team to map the data to your internal metrics such as sales, revenue, churn, or NPS
Over time, you’ll see a pattern: your best decisions came from acting on signals before anyone else did.
Five minutes every morning gives you an unfair edge, turning market chaos into executive clarity, and helping you lead when others are scrambling for answers.
Steal My Setup: Template & Scripts for Paid Subscribers
You’ve seen how this cockpit works.
Now imagine having the whole thing pre-built, ready to run, with every ticker, indicator, and alert already set for you.
If you’re a paid Solve with AI subscriber, you don’t have to build this from scratch.
I’m sharing my exact TradingView layout, custom Pine Script for the AI Sentiment Index, so you can duplicate my entire setup in minutes.
One click, and you have every signal live, no copy-paste fatigue, no confusion.
The same alerts, trend lines, and visual cues I use every morning to see around corners.
Plus: a cheat sheet on how to adapt the cockpit to your industry, region, or risk profile. (Coming soon)
Download link and script below.
Keep reading with a 7-day free trial
Subscribe to Solve with AI to keep reading this post and get 7 days of free access to the full post archives.